Customer Support
Metrics: What To Track And Why In 2026
Most support dashboards track vanity metrics. The metrics that drive improvement are resolution rate, repeat contact rate, AI coverage, and content gap identification. Track those and the vanity metrics will follow.
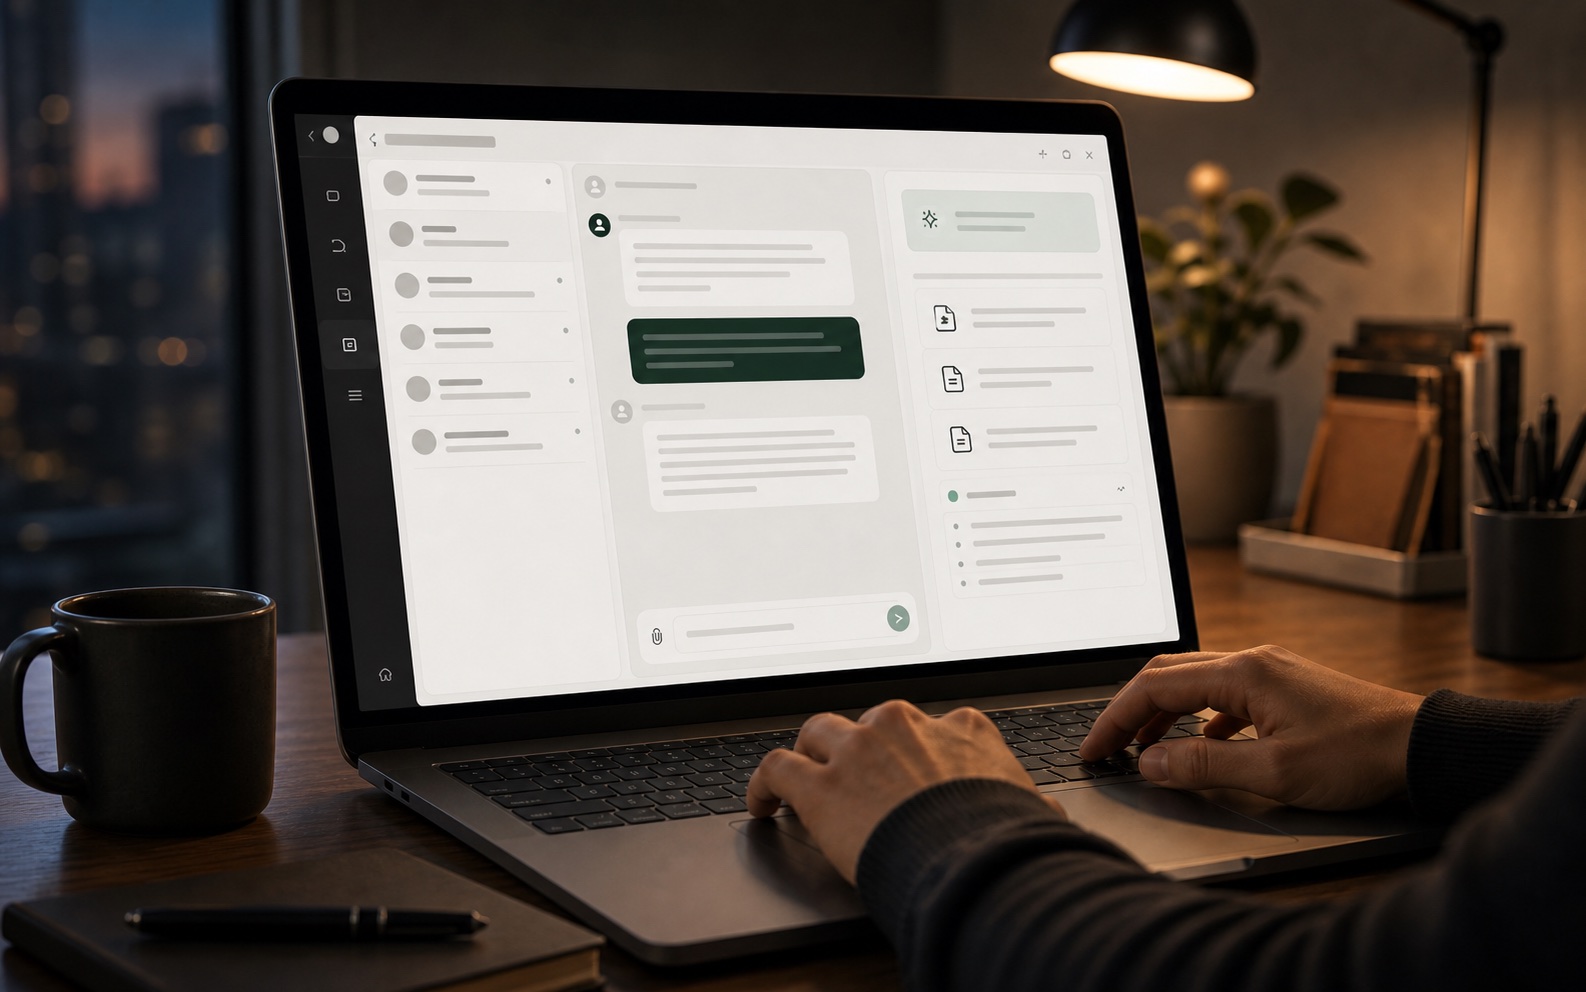
The customer support metrics that actually matter — beyond ticket count and first response time — and how to build a dashboard your team will use.
This page is structured so the team can scan, decide, and act without reading a generic long-form essay.
After reading, move into related problem pages or comparisons and turn the strongest topics into docs and SEO assets.
01. Resolution rate matters more than first response time
A fast reply that does not solve the problem is worse than a slower reply that resolves the issue. Track resolution rate per agent and per AI interaction separately so you can see where quality lives.
02. Track repeat contact rate as a quality signal
If a customer comes back within 48 hours about the same issue, the first interaction did not resolve it. This metric catches both human and AI failures that ticket-count dashboards miss.
03. Use AI coverage rate to guide content investment
AI coverage — the percentage of incoming questions the AI can answer from the knowledge base — tells you exactly where to write new content. Every gap in coverage is a candidate for a new help article.
04. Make the dashboard visible to the whole team, not just managers
When agents see resolution rates and coverage gaps in real time, they become part of the improvement loop. Transparency drives better content suggestions and faster issue resolution.